
Intel PresentMon 2.6 Cuts Monitoring CPU Use by Up to 78% and Adds New Frame Analysis Tools
Benchmarking software is supposed to measure performance, not become part of the workload. Intel says PresentMon 2.6.0 significantly reduces that problem by cutting the monitoring service’s own CPU use by up to 78% under load, while also adding new tools for analyzing frame delivery, DirectX 12 shader compilation, displays, and hardware telemetry. The reduction applies specifically to PresentMon’s processing overhead rather than game performance, but it could make the tool considerably less intrusive during demanding benchmarks.
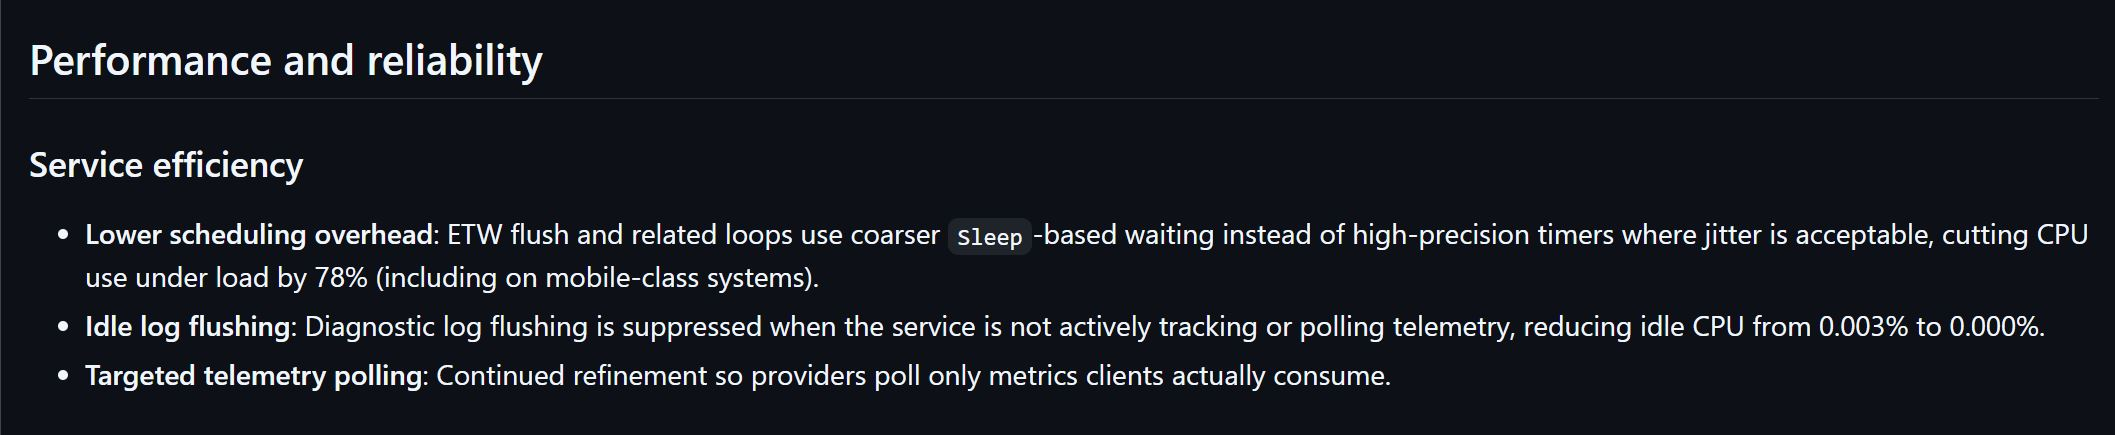
According to the official PresentMon 2.6.0 release notes, Intel reduced scheduling overhead by replacing high precision timers with coarser Sleep based waiting for ETW flushing and related operations where extremely precise timing is unnecessary. Intel measures the resulting CPU usage reduction at up to 78% while PresentMon is operating under load. Diagnostic log flushing is also suspended when the service is not tracking a game or polling telemetry, reducing reported idle CPU use from 0.003% to effectively 0.000%. These changes are particularly relevant for performance analysis because a monitoring application consuming fewer processor resources is less likely to influence the workload being measured.
PresentMon 2.6.0 also changes how telemetry is collected. Instead of continuously polling every available metric, the new architecture uses more granular providers so only the hardware information requested by the active client needs to be queried. Intel has moved AMD ADL, NVIDIA NVAPI and NVML, Intel Graphics Control Library, and Windows WMI telemetry onto the same dynamic capability and polling model, while the overlay can now display metrics from multiple graphics adapters simultaneously. PresentMon remains hardware independent despite being developed by Intel, supporting Intel, AMD, and NVIDIA systems alongside DirectX 9, DirectX 11, DirectX 12, OpenGL, and Vulkan.
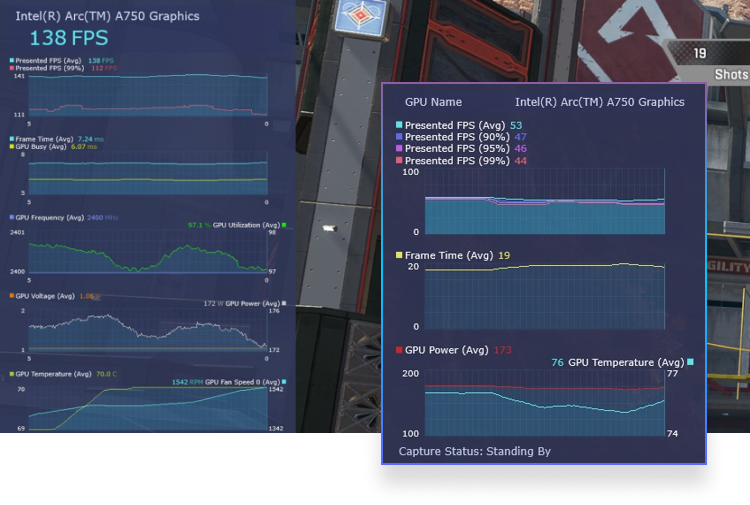
For players and reviewers, one of the most visible additions is the new Game Experience preset. Rather than displaying only traditional figures such as FPS and utilization, the preset groups metrics Intel believes better represent perceived motion and animation quality. PresentMon already includes measurements such as GPU Busy and detailed frame timing, allowing users to compare how long the CPU and GPU spend preparing frames instead of relying entirely on an average FPS counter. This makes the software increasingly useful for identifying CPU limits, GPU limits, inconsistent frame delivery, and other behavior that may not appear clearly through a single performance number.
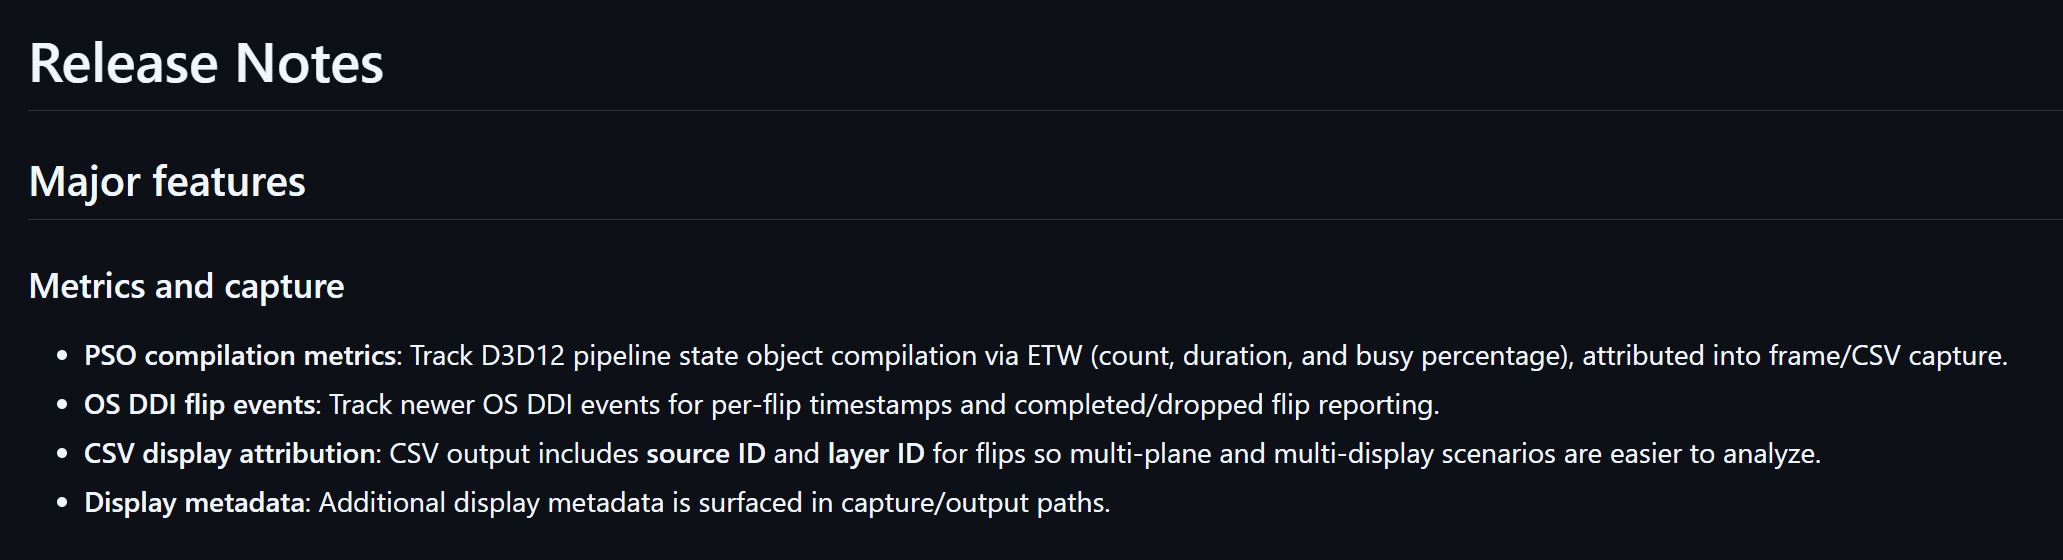
Developers and hardware testers receive additional DirectX 12 analysis tools. PresentMon can now track Pipeline State Object compilation through Windows ETW, recording the number of PSO compilations, their duration, and the percentage of time spent compiling. Shader and pipeline compilation are common sources of PC gaming stutter, so being able to correlate those events directly with captured frames should make it easier to determine when a visible hitch is associated with pipeline preparation rather than GPU rendering performance. The update also adds newer Windows DDI flip events, completed and dropped flip reporting, source and layer identifiers for multi display environments, and additional display metadata.
The interface has also become clearer when a particular metric is unavailable. Instead of removing unsupported telemetry from the selection menu, PresentMon 2.6.0 leaves the metric visible and explains why it cannot be collected on the current device or software configuration. Array based metrics, such as systems containing several GPU fans, are now grouped under a single metric with an index selector rather than appearing as several separate entries.
PresentMon occupies an increasingly important position in PC performance testing because its open source components can also be integrated into third party applications. It joins a growing range of tools designed to move benchmarking beyond simple FPS measurements. AIDA64 v8.30 adding its own AIDA FPS monitoring system, while PresentMon focuses more heavily on detailed frame presentation, latency, GPU workload, and now pipeline compilation analysis.
The 78% number is impressive, but the important part is what Intel actually reduced. PresentMon is not suddenly making games 78% faster. Intel has reduced the CPU resources required by its own monitoring service, which is arguably more valuable for a benchmarking tool because measurement software should interfere with the test as little as possible.
The new PSO compilation tracking may be equally useful. Average FPS can tell you that performance dropped, but it cannot explain why. Combining frame data with pipeline compilation, GPU Busy, dropped flips, and hardware telemetry gives reviewers and developers more information to separate genuine rendering limits from shader compilation or CPU scheduling problems.
When testing game performance, do you still focus mainly on average FPS, or are frame times, GPU Busy, latency, and shader compilation becoming more useful measurements?
